Why Customers Leave: A Deep Dive into Churn Analysis
Introduction
Customer churn, the rate at which customers stop doing business with a company, is one of the most critical metrics for any subscription-based service. After my first Python analysis, which explored Netflix’s content composition, I realized that studying churn could provide even more actionable insights for businesses.
In this analysis, I am working with a dataset from a telecom company, containing detailed customer activity, service usage, and billing information. Using Python, I focus on exploring relationships and correlations between variables to identify what distinguishes customers who churn from those who stay. Moreover, by examining tenure, monthly charges, contract types, and service usage, this deep dive aims to uncover which customers are at risk of leaving and why.
The data used for this analysis comes from the Telco Customer Churn dataset on Kaggle, which contains anonymized customer records from a telecommunications company and is widely used in the data science community for churn analysis projects.
View full code on Github (churn_analysis.py and analysis.py).
1. Data Overview and Cleaning
To begin the analysis, I first loaded the Telco Customer Churn dataset into a pandas DataFrame. This dataset contains information about customers’ demographics, services, and billing.
| Column | Description |
|---|---|
gender | Customer gender |
SeniorCitizen | Whether the customer is a senior (1) or not (0) |
Partner / Dependents | Family information |
tenure | Months with the company |
PhoneService, InternetService | Type of service used |
Contract | Month-to-month, one year, two year |
PaymentMethod | How the customer pays |
MonthlyCharges / TotalCharges | Billing information |
Churn | Whether the customer left (Yes/No) |
After that, I performed an initial data exploration to get an overview of the dataset, including the structure, variable types, column names, and presence of missing and duplicate values.
Next, I moved on to data cleaning, based on the oveview I got from previous data exploration. In particular:
- I mapped the variable
SeniorCitizen, which was originally coded as a dichotomous numeric variable (0/1), into a clearer format that makes the data easier to interpret, especially in visualizations.
def mapping_dichotomous(df: pd.DataFrame, variable: str):
    df[variable] = df[variable].map({0 : 'No', 1 : 'Yes'})
    print(df[variable].head())

analysis.mapping_dichotomous(telco_df, 'SeniorCitizen')
- The
TotalChargescolumn was stored as an object (string) instead of numeric, so I converted it to a numerical data type and properly handled any null values in the process.
def object_to_numerical(df: pd.DataFrame, object_variable: str):
    df[ object_variable] = pd.to_numeric(df[ object_variable], errors= 'coerce')
    print(f'Null values for {object_variable}:', df[object_variable].isnull().sum())
    nan_totcharges = df[df[object_variable].isnull()]
    print(nan_totcharges)
    df = df.dropna(subset = [object_variable])
    print(f'Null values for {object_variable} after cleaning:', df[object_variable].isnull().sum())

    return df

telco_df = analysis.object_to_numerical(telco_df, 'TotalCharges')
In this case, the null values in TotalCharges accounted for only 11 observations out of a total of 7,043. Since this represents a very small fraction of the dataset, I decided to drop those rows, as their removal would not significantly impact the analysis.
- Finally, I separated the dataset into numerical and categorical variables. This distinction may be essential for many of the next steps in the analysis (such as correlations, aggregations, and visualizations), which will treat numeric and categorical data differently.
def split_numeric_categorical(df: pd.DataFrame):
    cat_cols = []
    num_cols = []

    for variable in df.columns:
        if df[variable].dtype == 'object':
            cat_cols.append(variable)
        else:
            num_cols.append(variable)

    return num_cols, cat_cols

num_cols, cat_cols = analysis.split_numeric_categorical(telco_df)
At this stage, the dataset is clean, consistent, and structured, making it ready for deeper analysis.
2. Descriptive Analysis and Visualizations
Once the data was cleaned and structured, I moved on to a descriptive analysis to better understand the characteristics of the customer base and the distribution of key variables.
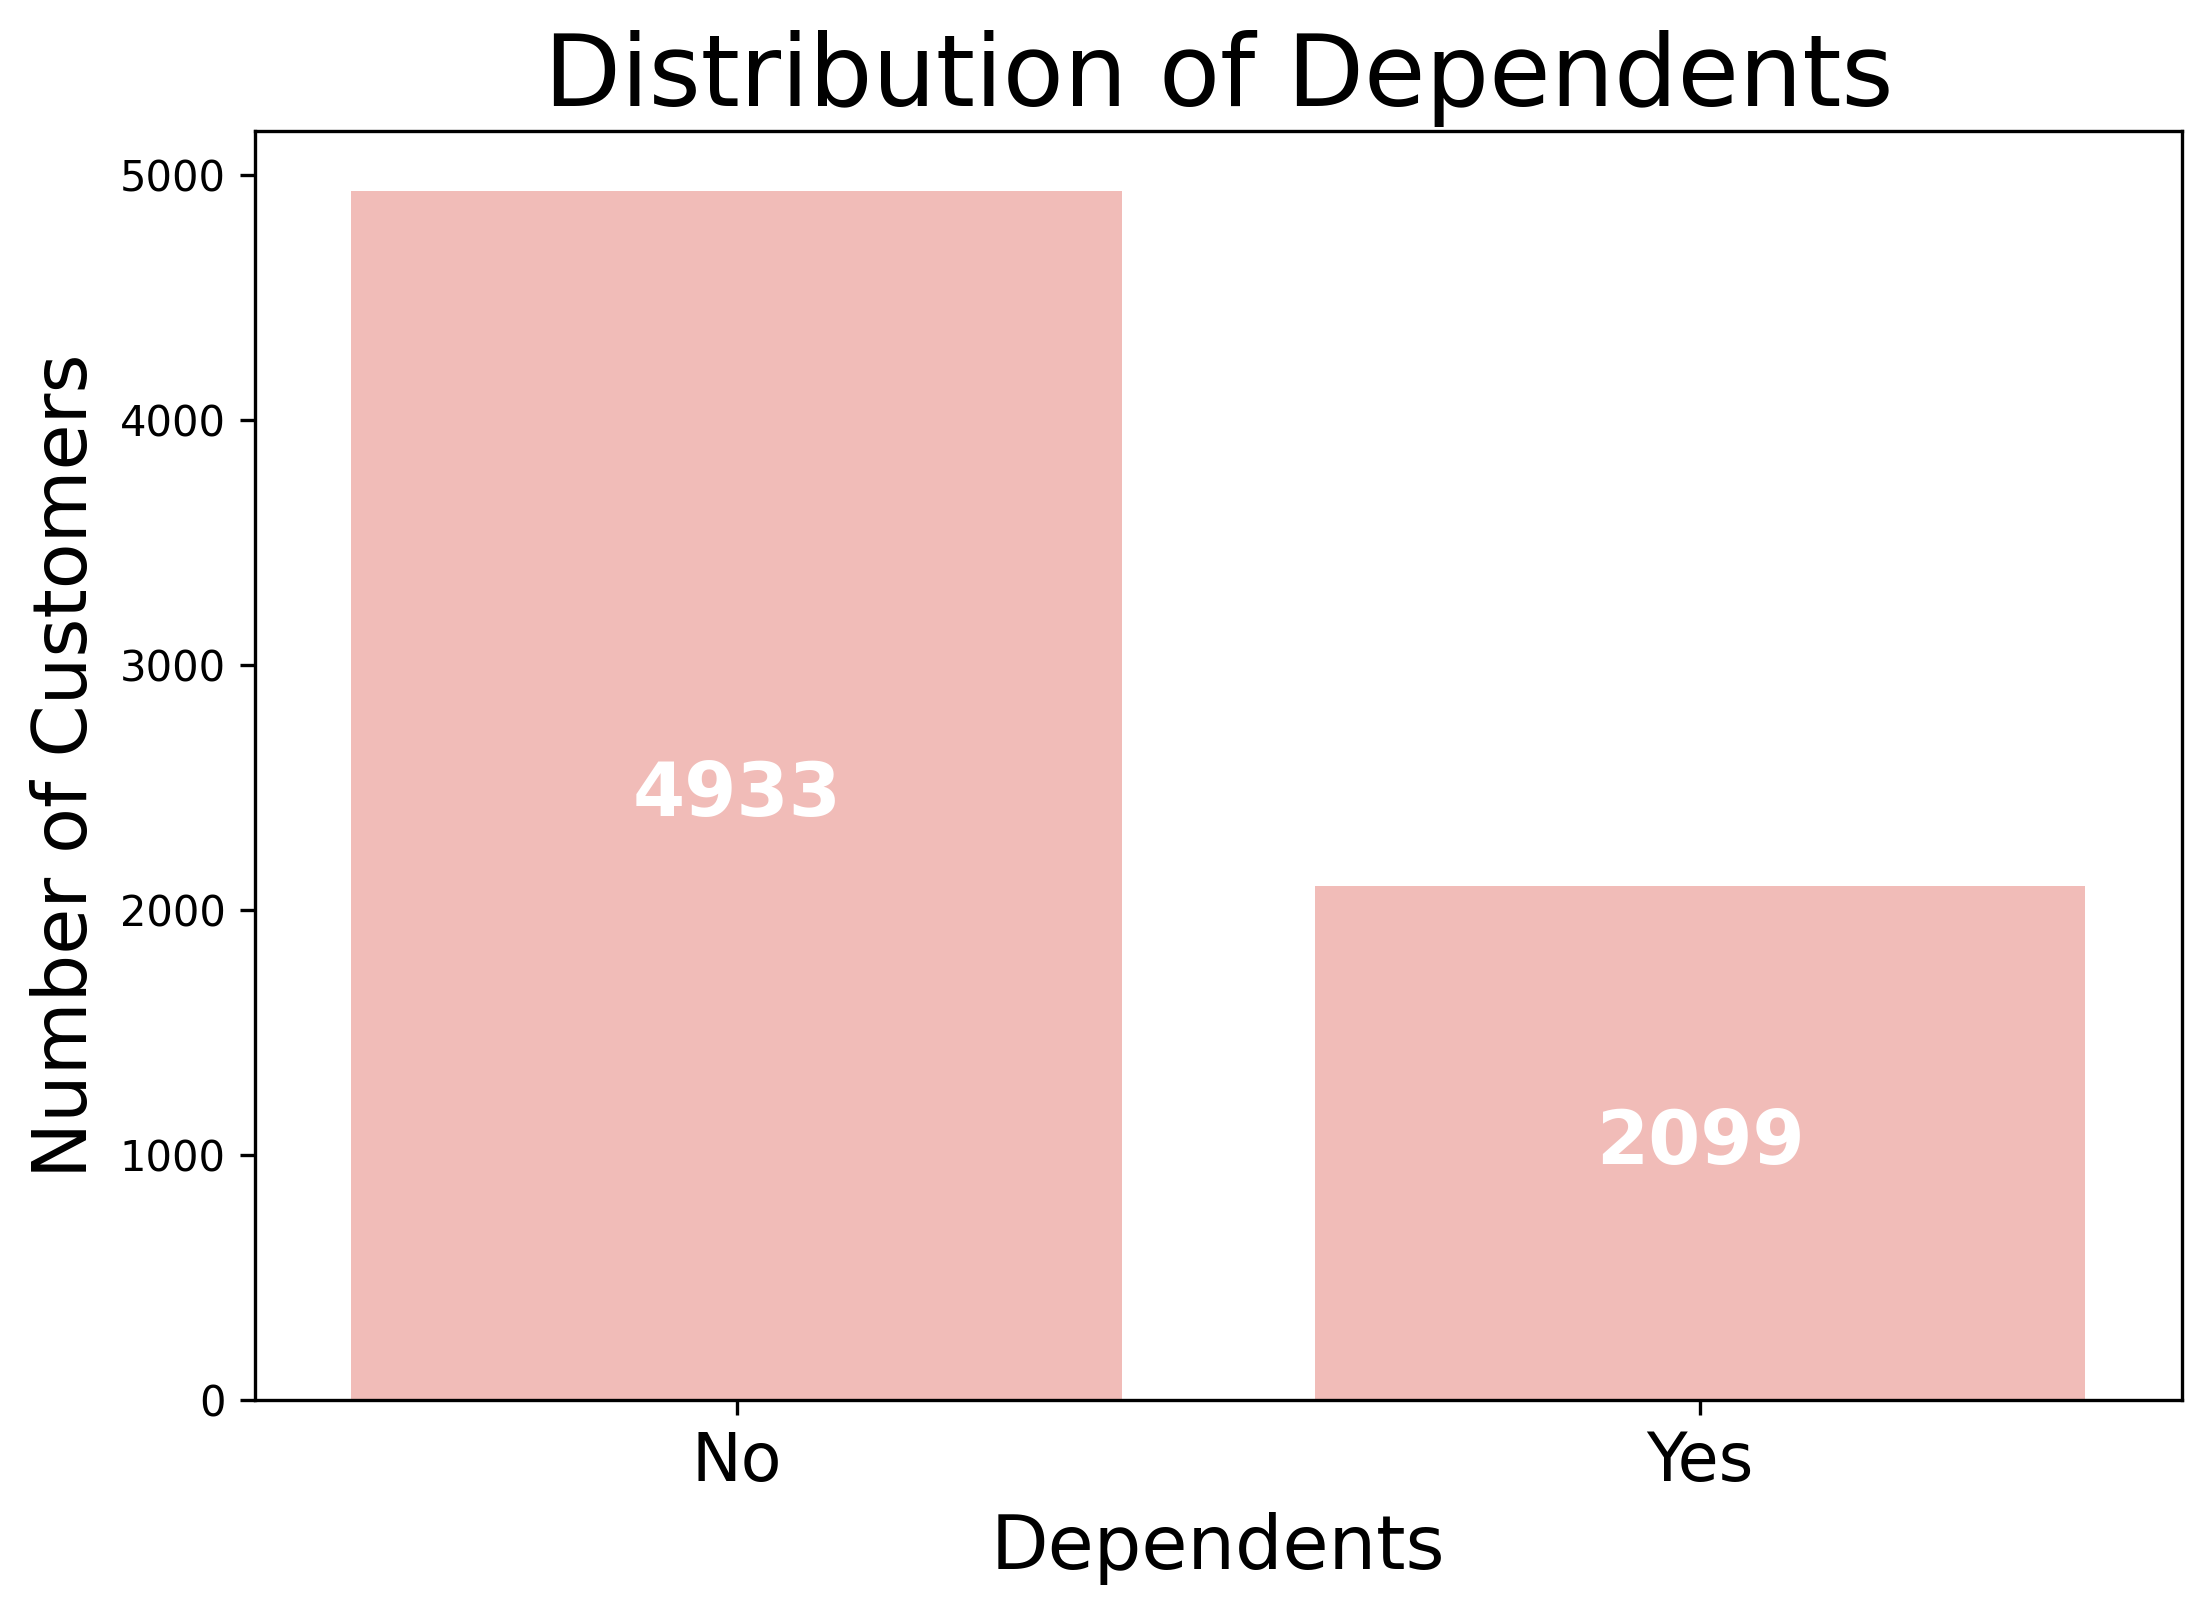
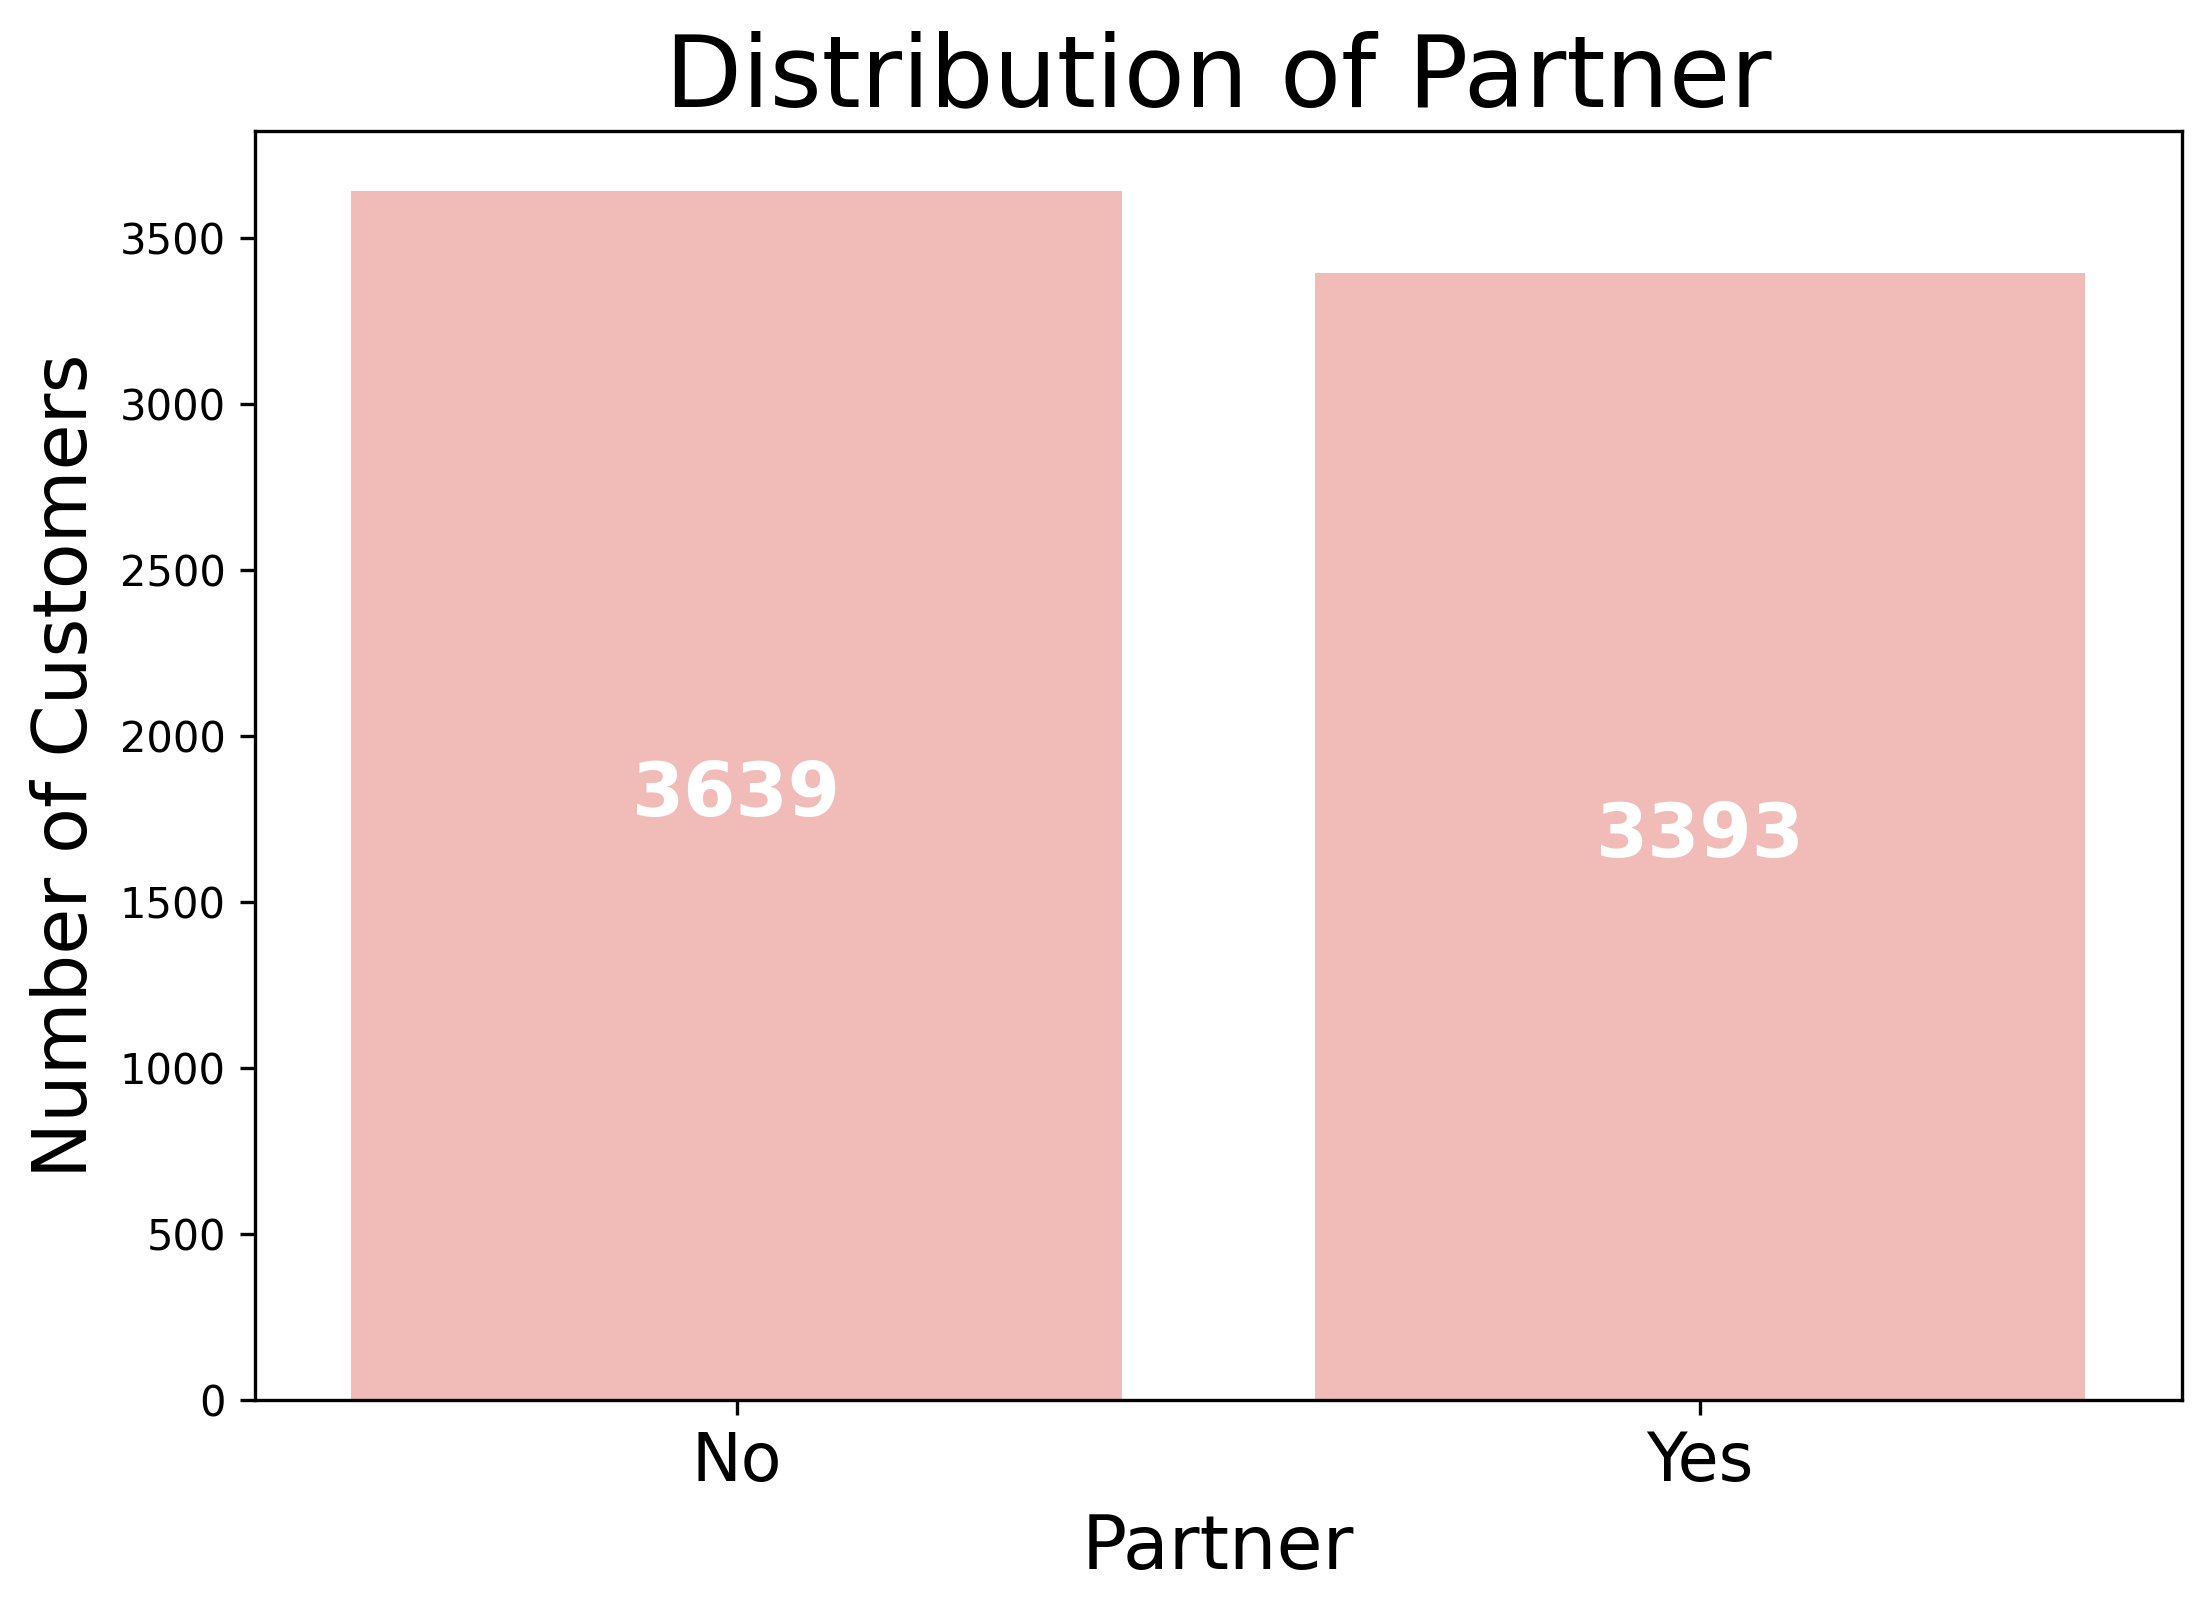
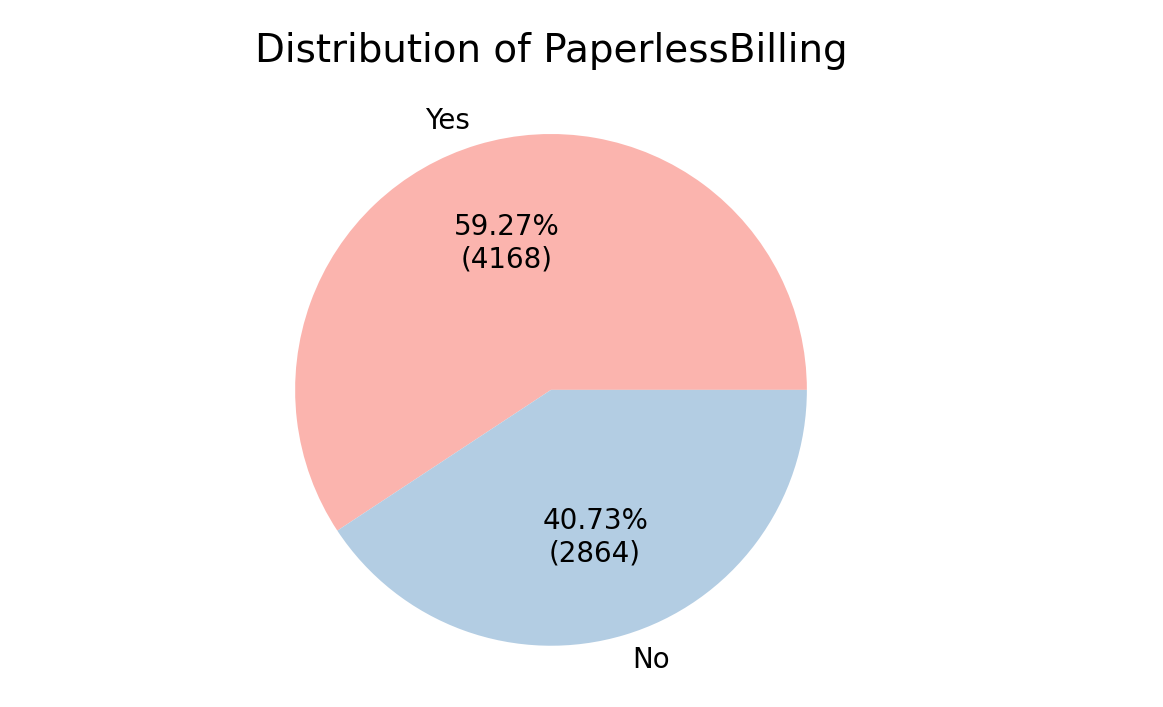
I started with visualizations of the categorical features. For example, I created pie charts and bar plots to explore the distributions of gender, SeniorCitizen, Partner, Dependents, Contract, PaperlessBilling, and PaymentMethod. These plots provide a quick overview of how customers are distributed across different categories, as well as any imbalances in the dataset.


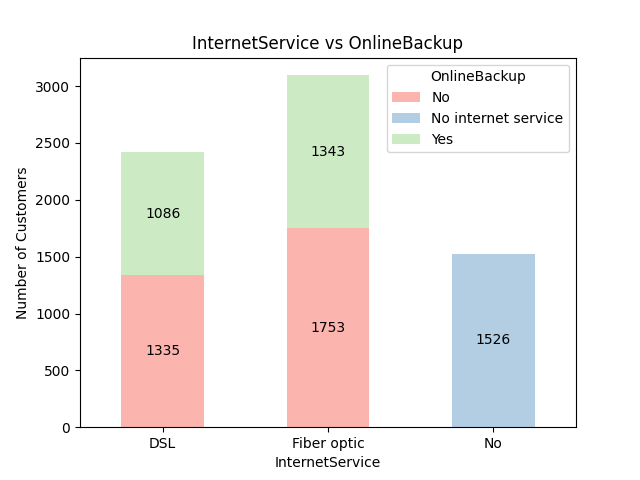
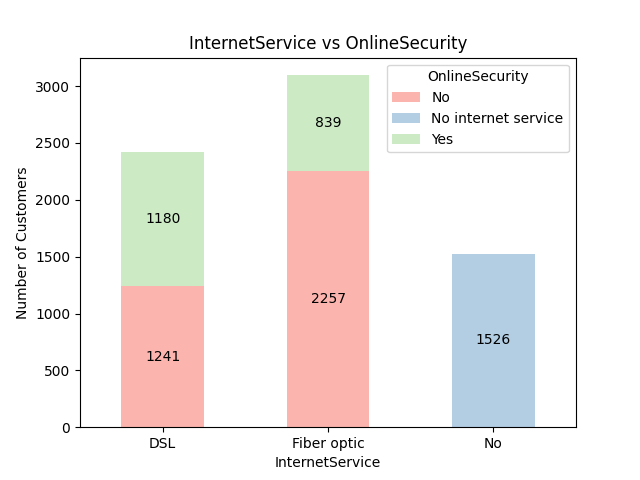
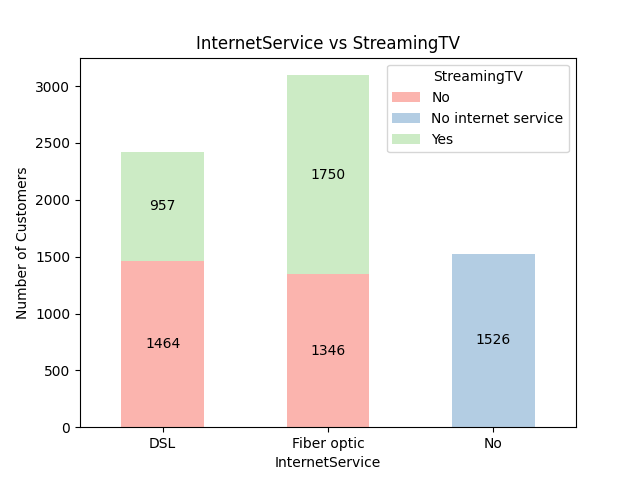
Moreover, to better understand the relationships between certain features, I used stacked bar charts. This type of visualization was particularly useful because some variables in the dataset are directly connected.
For example, PhoneService and MultipleLines are related: customers who don’t have phone service are automatically labeled as having “No phone service” under the MultipleLines column. Similarly, the InternetService variable influences several other service-related features such as OnlineSecurity, OnlineBackup, DeviceProtection, TechSupport, StreamingTV, and StreamingMovies. If a customer does not subscribe to internet service, all of these associated fields are set to “No internet service.”


Finally, I plotted and summarized the numerical columns using basic descriptive statistics (count, mean, std, min, max, and quartiles). This provided insights into the spread and central tendencies of variables such as tenure, MonthlyCharges, and TotalCharges.
| Statistic | Tenure | MonthlyCharges | TotalCharges |
|---|---|---|---|
| Count | 7032 | 7032 | 7032 |
| Mean | 32.42 | 64.80 | 2283.30 |
| Std | 24.55 | 30.09 | 2266.77 |
| Min | 1.00 | 18.25 | 18.80 |
| 25% | 9.00 | 35.59 | 401.45 |
| 50% | 29.00 | 70.35 | 1397.48 |
| 75% | 55.00 | 89.86 | 3794.74 |
| Max | 72.00 | 118.75 | 8684.80 |

tenure shows a U-shaped distribution. The majority of customers are either new (tenure close to 0) or long-term (tenure near the maximum of around 72). The number of customers in the middle range of tenure is significantly lower, suggesting that while the company successfully acquires new customers and retains a core group for the long haul, there might be a higher rate of churn or loss of customers in the early to mid-term.
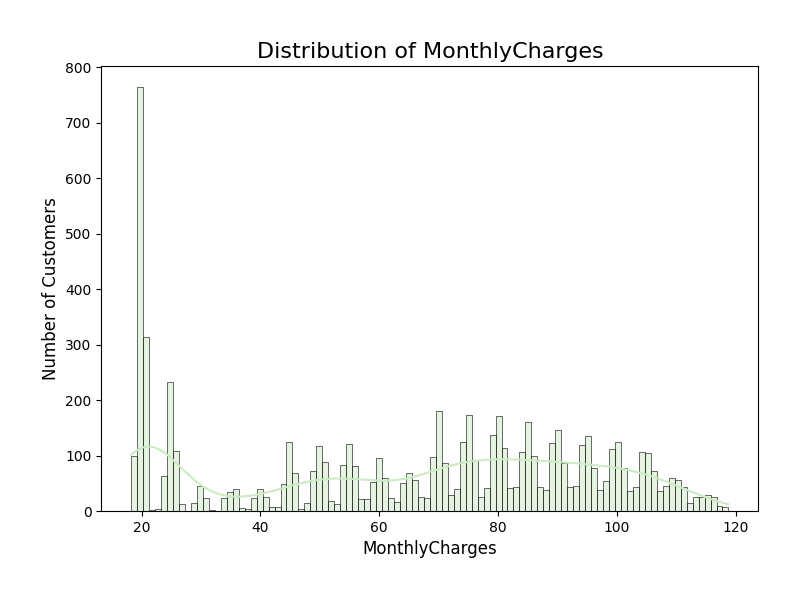
MonthlyCharges shows a distribution which is multimodal and skewed right. It has a very large peak at the low end of charges, indicating a substantial group of customers with minimal monthly fees. After this initial peak, the distribution shows a more complex pattern with several smaller peaks. This suggests the customer base is segmented into different pricing tiers or plan bundles.
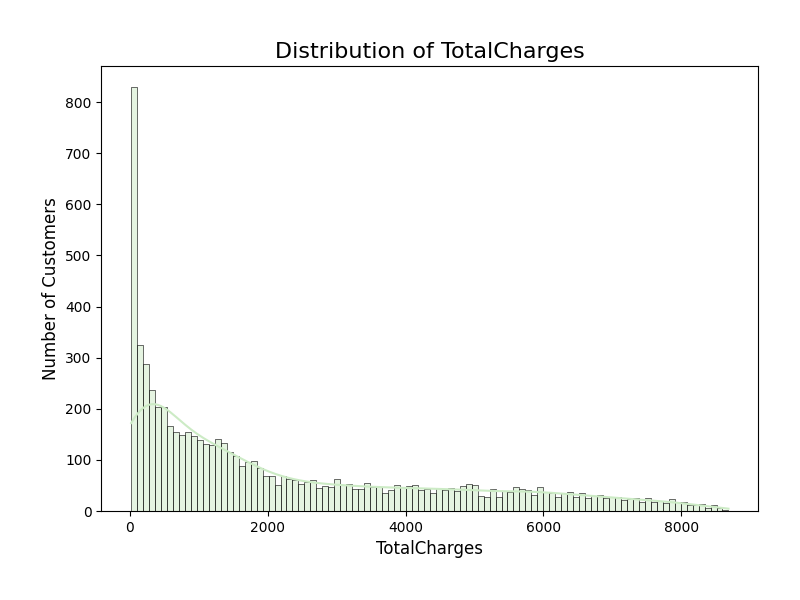
TotalCharges’s distribution is highly right-skewed. The vast majority of customers have low Total Charges, which is consistent with the high number of new customers seen in the tenure plot. The number of customers steadily decreases as TotalCharges increases. This indicates that fewer customers remain with the company long enough to generate very high total charges.
This descriptive step laid the foundation for identifying key differences between customers who churn and those who remain, highlighting variables worth exploring more deeply in the next stages of analysis.
3. Churn Analysis
Categorical Variables
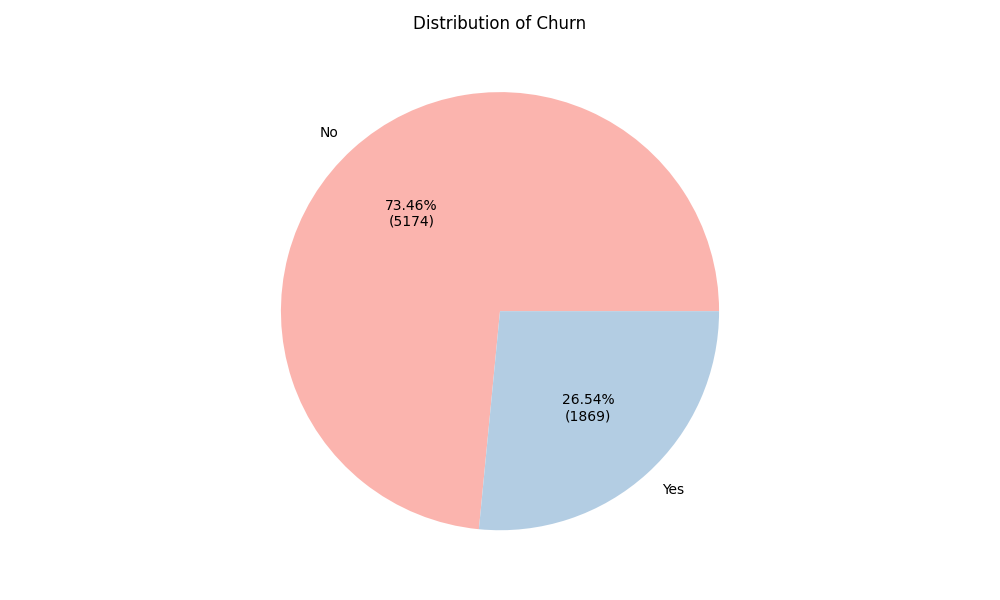
I started the analysis with a look at the overall churn rate. As the pie chart shows, 26.5% of customers (1,869 out of 7,043) ended up leaving the company, while 73.5% (5,174 customers) stayed. This is an important first step, as it highlights the magnitude of the churn problem: more than one in four customers are leaving. Such a high percentage makes it clear why churn is a key issue for the business, and sets the stage for the next question: which factors are driving it?
Therefore, I examined how churn relates to categorical variables such as gender, SeniorCitizen, Partner, Dependents, MultipleLines, InternetService, Contract, PaperlessBilling, and PaymentMethod. For each of these, I generated crosstabs showing churn percentages and visualized them using stacked bar charts. This step highlights how customer churn is distributed across different categories, making it easier to spot patterns, such as higher churn among customers on month-to-month contracts compared to those with longer-term agreements.
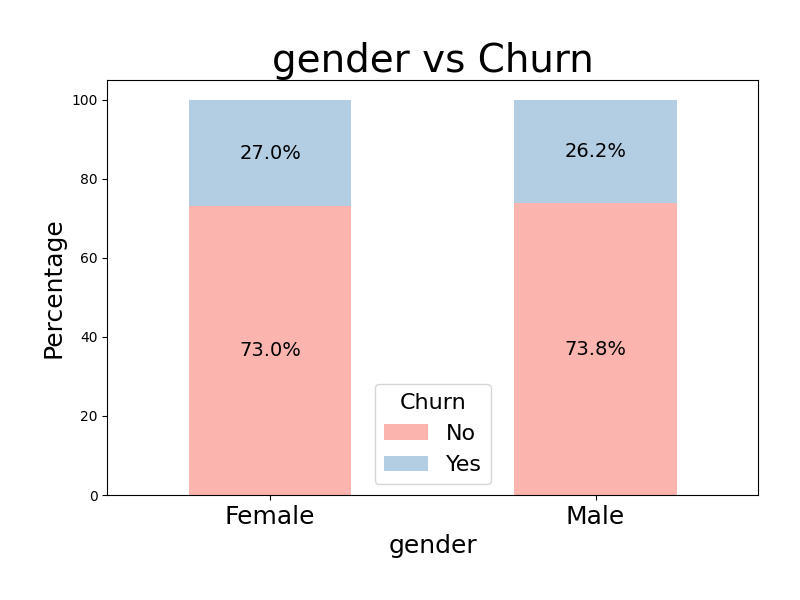
gender does not seem a significant predictor of churn, as the rates are nearly identical for female (27%) and male (26.2%) customers.
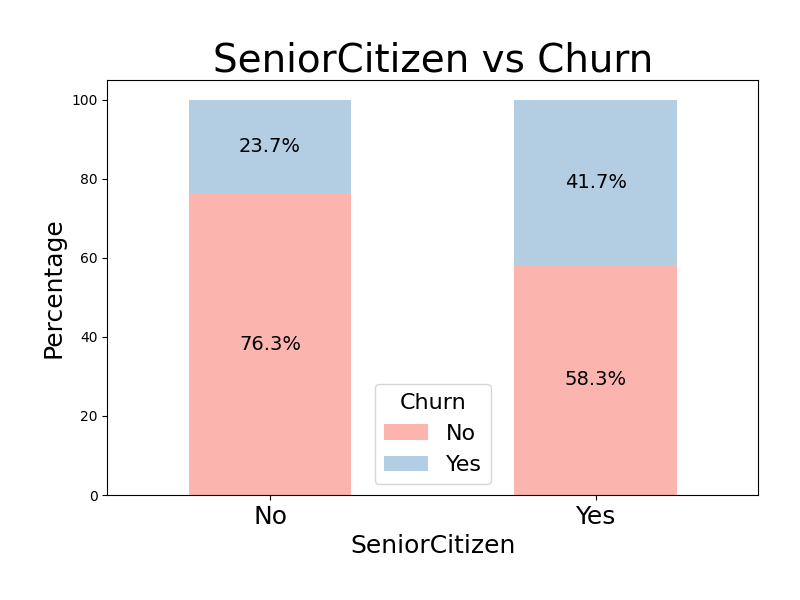
On the other hand, Senior Citizens are a major high-risk group, churning at 41.7%, a rate nearly twice that of non-senior citizens (23.7%). This evidence makes SeniorCitizen a very significant factor in customer retention efforts.


Both Partners and Dependents act as strong insulators against churn. Customers without a Partner show a much greater tendency to churn (33%) than those with one (19.7%). Similarly, customers without Dependents are twice as likely to churn (31.3%) as those with dependents (15.5%). Having a partner or dependents signals significantly higher customer stability.
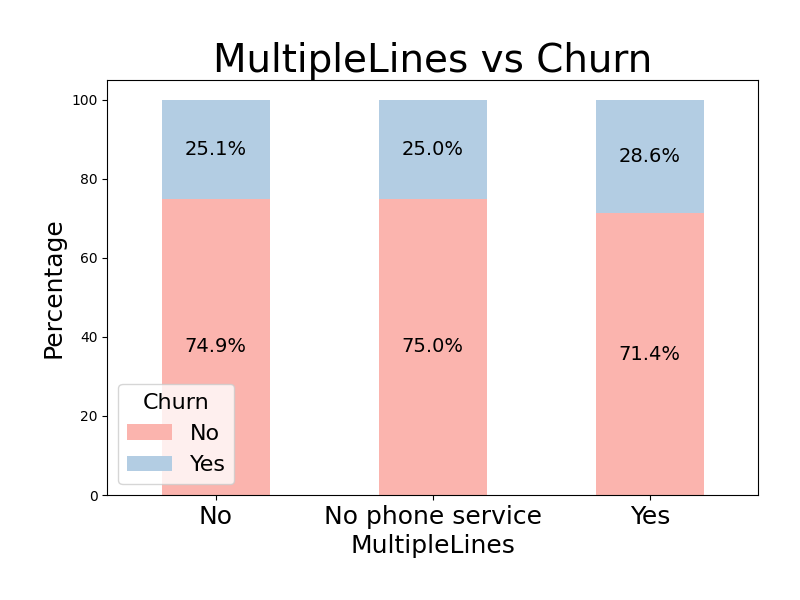
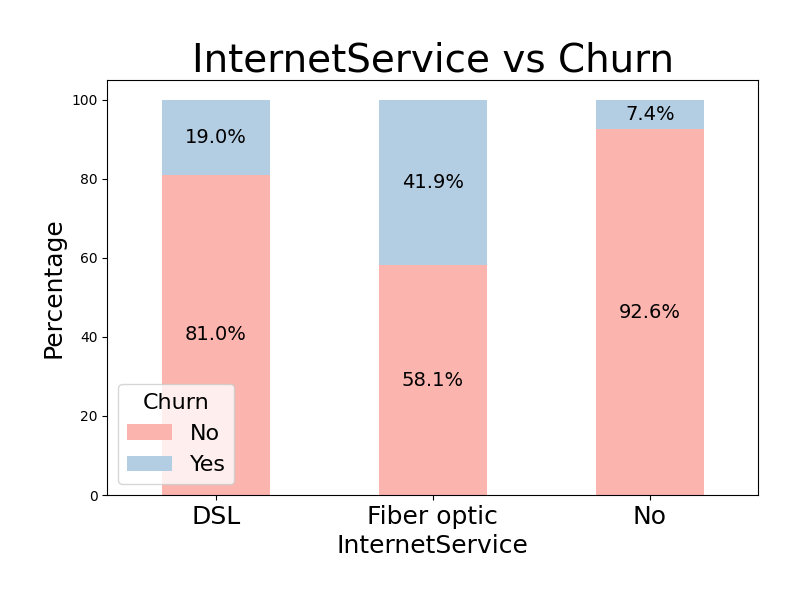
MultipleLines has a minimal effect on churn risk, with customers using multiple lines churning only slightly higher (28.6%) than customers without multiple lines (25.1%) and those without any phone service (25%). In sharp contrast, InternetService is a critical differentiator: Fiber optic service drives a massive churn rate (41.9%), while having No internet service is the safest status (7.4%).
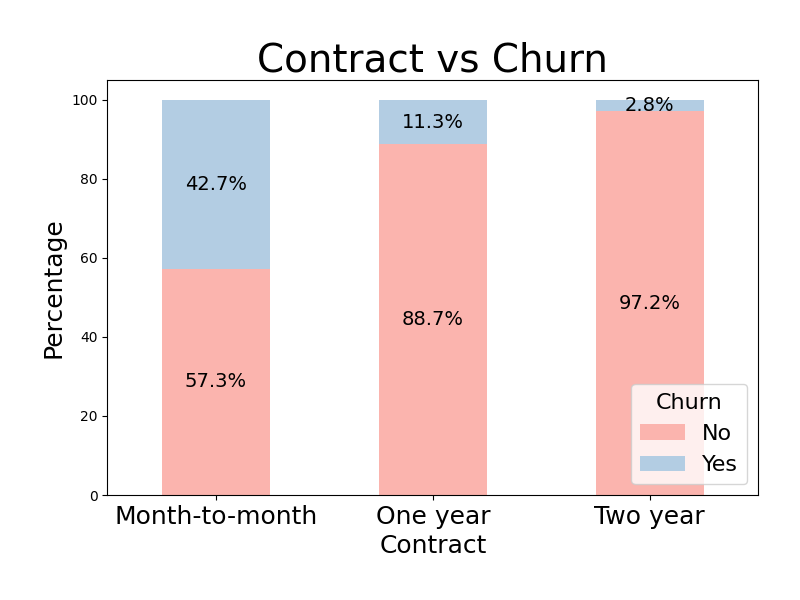
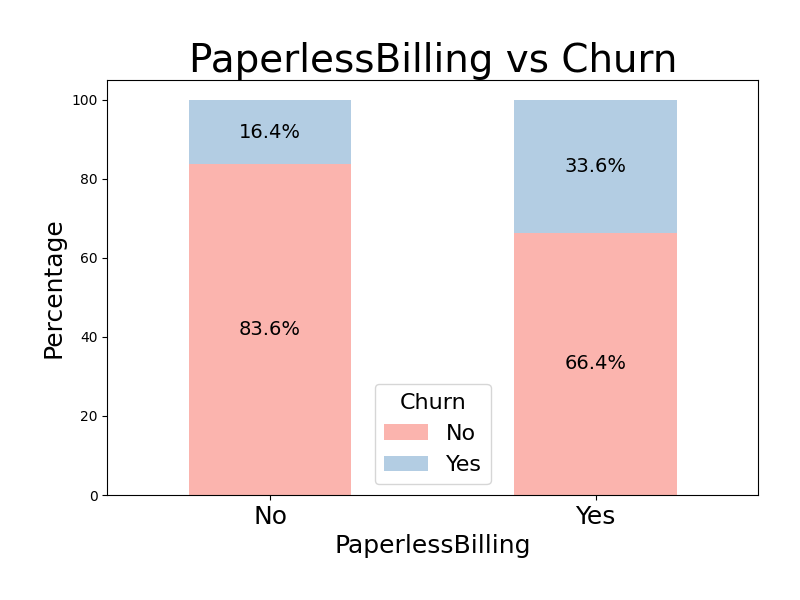
Contract and PaperlessBilling are also strong predictors of churn. Contract type is the most powerful influence, with Month-to-month customers churning at an extremely high rate (42.7%) compared to the significantly lower churn of customers with one year contract (11.3%) and the negligible churn of Two year contract holders (2.8%). Additionally, customers who use Paperless Billing are much more likely to churn (33.6%) than those who do not (16.4%).
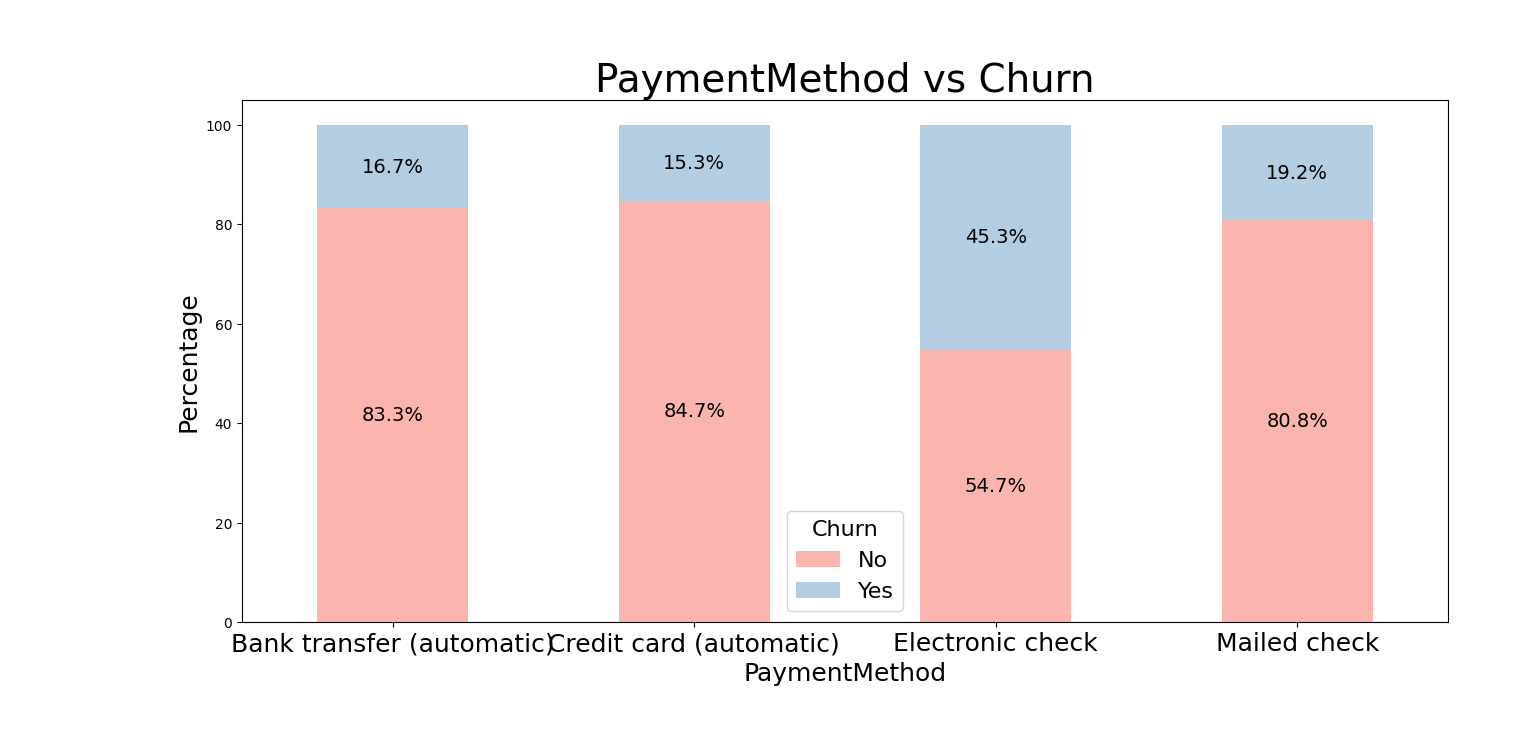
Finally, Payment Method clearly separates high and low-risk customers. Electronic check is by far the riskiest method, resulting in an exceptionally high churn rate (45.3%). Automatic payments (Credit card at 15.3% and Bank transfer at 16.7%) are associated with the lowest, most stable retention rates.
Numerical Variables
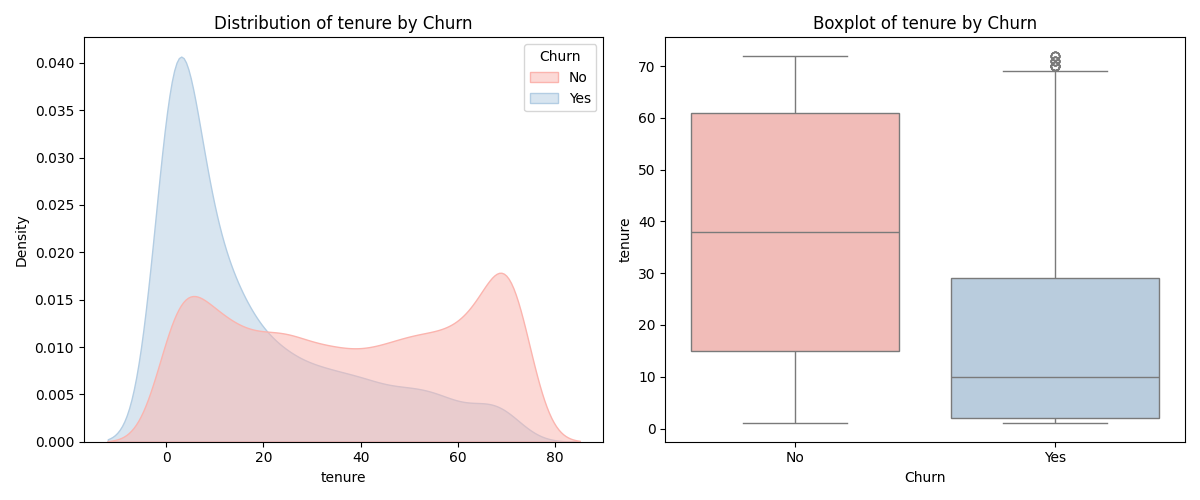
Customers who churned typically have shorter tenures, as seen in both the density and boxplots. In contrast, long-term customers tend to remain loyal. This pattern suggests that newer customers are at a higher risk of churning, while those who stay longer are more likely to continue their subscription.
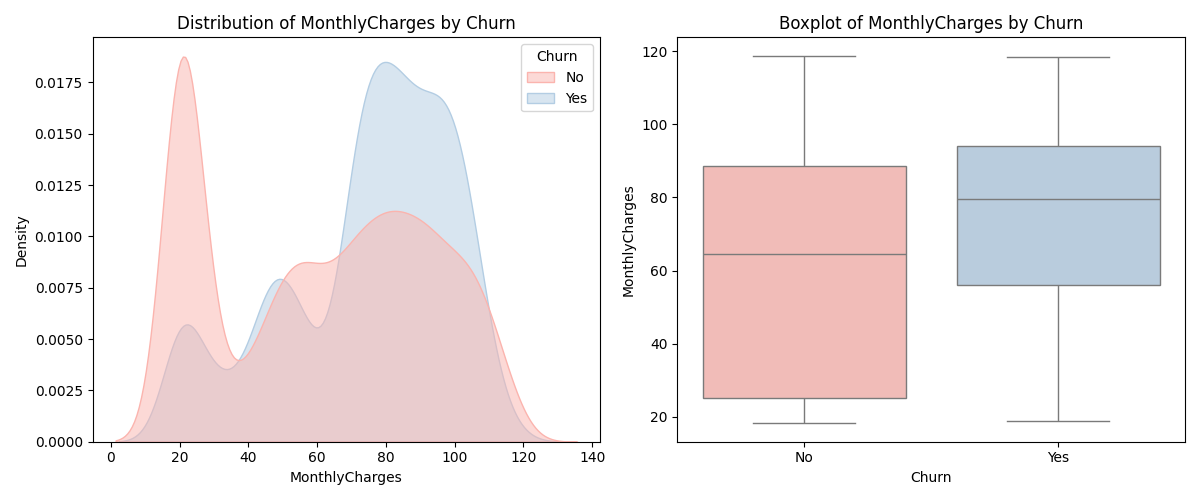
Both the density and boxplots for MonthlyCharges reveal that customers who churned generally face higher monthly costs, with their spending concentrated at the upper end. Meanwhile, customers who stay tend to pay lower charges. This highlights a possible link between higher monthly fees and an increased likelihood of churn.
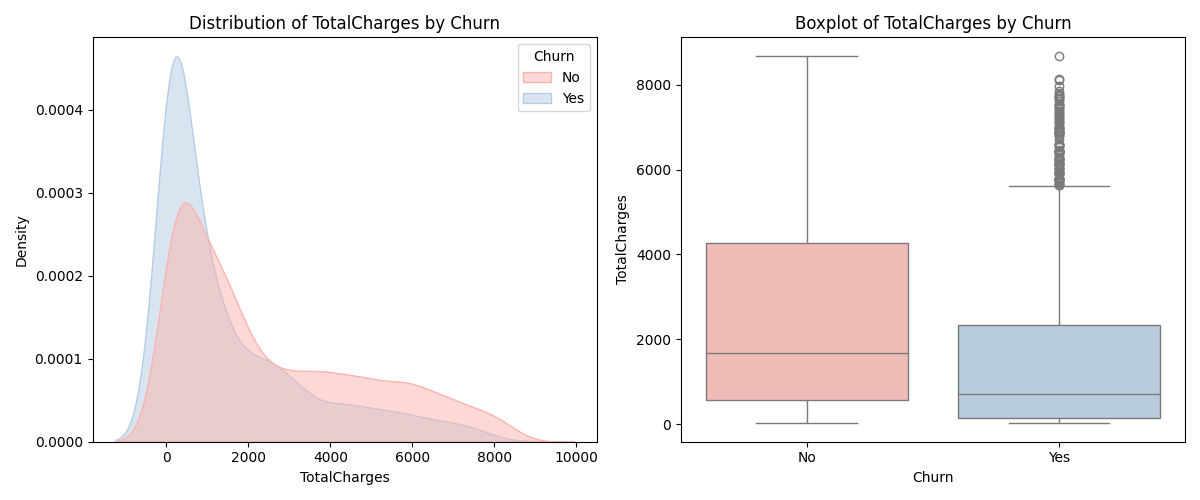
When looking at TotalCharges, both plots show that churned customers usually have lower total spending, while loyal customers have accumulated higher overall charges. This trend indicates that customers with shorter relationships or lower lifetime value are more prone to leave.
Multivariate Segmentation
In this first part of this analysis I explored how churn is distributed across individual variables, which provided meaningful insights on the variables having a stronger influence on churn rate. While that univariate exploration helped highlight the most influential factors one by one, I decided to switch to a multivariate segmentation approach, by grouping customers based on combinations of characteristics that jointly describe their behavior and engagement level.
For this, I built segments around three main dimensions:
- Personal characteristics (age group, partner, dependents);
- Contract stability (contract type and tenure);
- Billing and payment behavior (paperless billing, payment method, monthly charges).
Each dimension was divided into high-risk and low-risk categories based on the patterns observed earlier in the univariate analysis. This allowed me to see how different risk factors overlap and amplify each other, revealing which customer profiles are most likely to churn and which are the most loyal.
| Segment | Size | Churn % |
|---|---|---|
| Riskiest Segment (all variables combined) | 50 | 76% |
| Low-Risk Segment (all vars) | 192 | 1% |
| High-risk People | 561 | 49.2% |
| Low-Risk People | 1657 | 13.8% |
| High-risk billing | 989 | 50.3% |
| Low-risk billing | 942 | 8.9% |
| High-risk contract | 1908 | 51.9% |
| Low-risk contract | 2343 | 7% |
| HR (high-risk billing + contract) | 251 | 76.9% |
| LR (low-risk billing + contract) | 487 | 2% |
Key Insights
The overall pattern is consistent and logical: every high-risk group shows churn rates around 50% or higher, roughly double the global average (26.54%). On the other hand, the low-risk groups show very low churn rates, well below the average.
The strongest churn driver seems to be contract instability. With a churn of 51.9% across 26.54% of the base, it counts 1,908 customers, a huge number comprising more than one fourth of the entire population. This highlights how the short-term, month-to-month contract structure creates a transactional relationship. Customers in this phase are testing the service and can leave anytime.
Billing behavior also matter, with a churn rate of 50.3%, counting 989 people (14% of the total population). These customers are more price-sensitive and less “attached”, they pay electronically, see no invoices, and notice high bills.
Personal characteristics matter, but less than structural ones. The segment of risky people (senior citizens with no partners and dependents) churns at 49.2%, including 561 customers or 8% of the total population. This highlights how demographics amplify churn risk, but the contract and billing experience are the primary triggers. Senior, isolated customers might need targeted support, but contract design and billing drive broader trends.
4. Business Insights and Retention Strategies
The segmentation analysis reveals that churn is not evenly distributed across the customer base. Instead, it is concentrated within specific groups whose behaviors and contracts make them more likely to leave. Understanding these drivers allows the company to design targeted, cost-effective retention initiatives instead of applying generic discounts or campaigns to everyone.
Contract and Tenure: Strenghten Relationship Stability
Customers on month-to-month contracts and with low tenure have churn rates above 50%, nearly double the overall average. This shows that short-term agreements, as well as weak initial relationships, are major churn triggers.
Strategies:
- Introduce renewal incentives, for example, by offering discounts or extra services for customers who switch to a one-year or two-year plan before their first contract ends.
- Offer contract flexibility upgrades (for instance, loyalty credits that increase with contract duration).
- Build predictive alerts around tenure milestones (3, 6, 12 months) to proactively engage customers before they leave.
Overall, make it easy and worthwhile for these customers to stay longer. That doesn’t mean forcing them into a long contract, it means rewarding loyalty. Offer small bonuses for every 6 months they stay, like an internet speed boost or streaming credits.
Billing and Payment
Customers who pay via electronic check, use paperless billing, and face high monthly charges churn around 50%, compared to less than 10% for those using automatic payments. These patterns reflect low engagement and higher price sensitivity.
Strategies:
- Encourage automatic payment methods (bank transfer or credit card) with small incentives or loyalty points, and clearly explain their benefits (no missed payments, less hassle, possible small discounts);
- Add optional billing transparency, monthly summaries that clearly show value received (services used, savings vs plan cost);
- Use personalized billing reminders or satisfaction prompts to keep paperless users more connected;
- Offer bundled plans that reward customers for combining services (internet + TV + phone) to increase perceived value and stickiness.
Customer Demographics: Support Vulnerable Profiles
Senior citizens or customers living alone have churn rates near 50%, suggesting they may need more assistance or clearer communication. This isn’t just about technology, it’s about trust and comfort. If support feels rushed or digital-only, these customers can feel lost and frustrated.
Strategies:
- Implement personalized customer support or “senior-friendly” help lines with simplified processes;
- Offer more human touchpoints, periodic check-in calls to ensure everything’s working fine;
- Create trust-building communication, emphasizing reliability, safety, and transparency;
- Use segmented messaging and tailor tone and language to life stage and digital comfort levels.
Customer Loyalty: Strengthen the Core Base
Low-risk customers are the most profitable and stable base. Retaining and rewarding them is as important as reducing churn among risky groups. But too often, they get ignored because they’re “not a problem.”
Strategies:
- Launch a loyalty program that rewards tenure and contract renewals;
- Offer exclusive upgrades or early access to new services for loyal customers;
- Use referral incentives (loyal customers often bring in new, high-quality clients);
- Track lifetime value LTV to understand and prioritize high-value customers.
6. Data Driven Retention Monitoring
One of the biggest lessons from this analysis is that churn doesn’t just happen, it builds up quietly through a mix of habits, contract types, and experiences. Once I’ve identified the risky groups, the real challenge is staying on top of them. This is where data becomes a living tool, not just a one-time project.
Therefore, I would implement a churn risk dashboard that continuously monitor churn across these key segments, like month-to-month customers, high billers, or seniors living alone. If churn suddenly spikes in one of those groups, it will be noticed right away and targeted actions would be implemented promptly (like outreach campaigns or pricing reviews).
Another practical step is to set up small, automated alerts or flags into the business’ CRM. For instance, if a customer matches the high-risk profile (month-to-month + electronic check + short tenure), your customer success team would be alerted about at-risk clients in real time.
The key idea is that churn prevention should be a habit. The patterns you discover today might shift in six months as things change. Keeping a continuous eye on these signals means the retention strategy evolves along with your customers.
7. Final Conclusions
In the end, this analysis shows that churn is not random, but reflects how people experience the service. Customers leave when their relationship with the company feels purely transactional. The patterns are clear: short-term contracts, impersonal billing, and high prices make customers feel disconnected, while long-term relationships, clear communication, and trust keep them around. By turning these insights into concrete actions, from smarter contract design to more human support, the company can shift from reacting to churn to actively preventing it.