What’s Really on Netflix? A Descriptive Analysis
Introduction
As one of my very first independent data analysis projects, I wanted to dive into a dataset that was not only rich in volume but also grounded in real-world relevance. The Netflix dataset turned out to be a perfect fit: over 6,000 titles, plenty of messy (and realistic) data, and a topic I, like many others, found genuinely interesting. After all, Netflix is arguably the most globally recognized streaming platform.
This project was more than just an attempt to uncover trends or answer questions, it was my personal introduction to the world of data analysis. My main goal was to learn by doing: to get hands-on experience, build confidence, and become more comfortable working with real data. I wanted to understand what it really means to explore, clean, and analyze a dataset from scratch.
That said, the dataset did offer plenty of interesting questions: What exactly does Netflix’s catalog consist of? Are movies or TV shows more prevalent? How has its content evolved over time? Which genres dominate, and which countries, actors, and directors shape the platform’s global reach? Through a mix of cleaning, visualizing, and exploring, I uncovered a number of trends, surprises, and storytelling opportunities, all while developing the foundational skills every data analyst needs.
The data used for this analysis comes from a Kaggle dataset on Netflix titles, originally published in 2021.
View full code on Github.
1. Data overview and cleaning
Before diving into any deeper analysis, I began with a systematic exploration of the dataset to verify it loaded correctly and to understand its structure and quality.
Following this initial overview, I focused on cleaning the dataset by identifying and handling missing values and duplicates, and reformatting key columns to make the data easier to work with and more accessible for analysis.
What I did:
- Inspected the dataset’s structure using
.head(),.tail(),.info(), and.columnsto preview the data, inspect data types, and assess completeness. - Checked for null values across all variables with
.isnull().sum(). - Removed or handled missing data depending on the column and context.
- Reformatted
date_addedinto proper datetime format and extractedyear_addedandmonth_addedto enable temporal analysis.
movies["date_added"] = movies["date_added"].str.strip()
movies["date_added"] = pd.to_datetime(movies["date_added"])
movies["year_added"] = movies["date_added"].dt.year
movies["month_added"] = movies["date_added"].dt.month
- Parsed the
durationcolumn into:duration_minutesfor movies (e.g., “90 min”)seasonsfor TV shows (e.g., “2 Seasons”)
movies["duration_minutes"] = movies["duration"].apply(lambda x: int(x.split(" ")[0]) if "min" in x else None)
movies["seasons"] = movies["duration"].apply(lambda x: int(x.split(" ")[0]) if "min" not in x else None)
movies = movies.drop(columns=['duration'])
Findings:
- Several columns (like
director,cast,country) had substantial missing values, typical of real-world datasets.
| Variable | Null Values |
|---|---|
show_id | 0 |
type | 0 |
title | 0 |
director | 2389 |
cast | 718 |
country | 507 |
date_added | 10 |
release_year | 0 |
rating | 7 |
listed_in | 0 |
description | 0 |
year_added | 10 |
month_added | 10 |
duration_minutes | 2410 |
seasons | 5377 |
Missing data for each variable could be explained by different reasons. For instance, the significant amount of missing data for director might be ralated to the lack of an actual director for some kind of shows, like reality shows. Indeed, TV productions typically involve multiple directors across episodes, making it harder to assign a single name. A closer look to the observations with missing values for the director variable reveals that the majority of them were actually TV Shows, with 2226 observation against 163 for Movies.
On the other hand, more movies than TV shows are missing cast data (426 versus 292), possibly because cast listings for TV shows are more prominently featured and curated, while smaller, less known, or older movies may lack complete metadata.
Moreover, values in country could be missing due to lack of information or multi-country production.
Finally, since the duration_minutes and seasons columns were created during the data cleaning process, where I separated the original duration field into two distinct variables, the presence of missing values in each is expected: if the entry refers to a movie, it logically lacks a seasons value, and if it’s a TV show, it doesn’t have a duration in minutes.
Notwithstanding the significant amount of null values for some variables, removing these rows entirely could lead to loss of valuable data. Therefore, I handled them based on the analysis context, by creating temporary filtered subsets (excluding nulls) when performing variable-specific analyses, like identifying the most frequent directors or countries.
2. Distribution of Contents
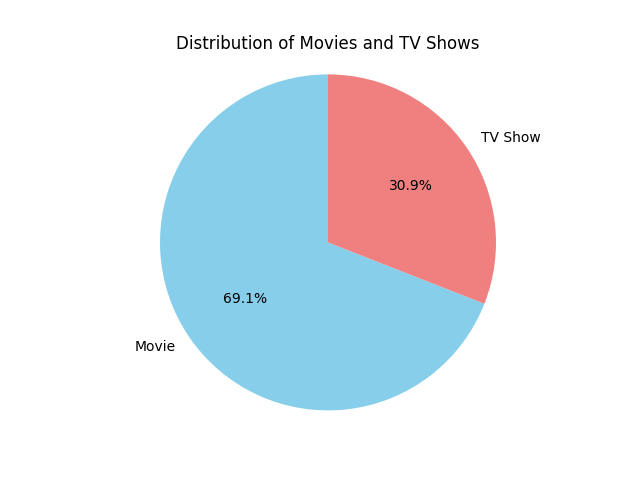
Netflix’s catalog is made up of two main types of content: Movies and TV Shows. When breaking down the dataset, I found a clear split between the two, with Movies representing almost two thirds of the content on the platform. In absolute terms, Neflix hosts 5377 movies and 2410 TV shows.
3. Content trends Over Time
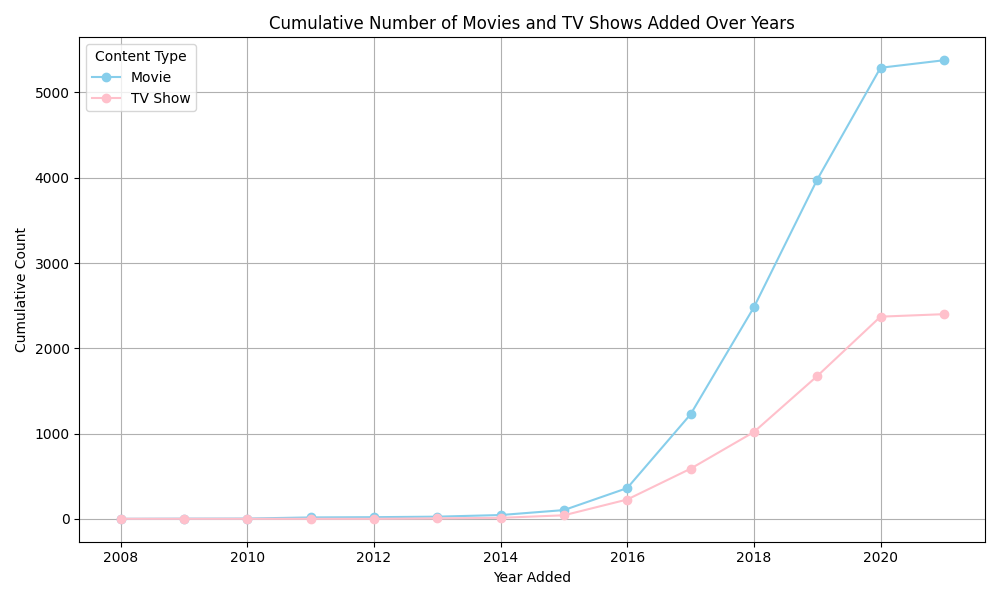
While both Movies and TV Shows are well represented, it is interesting to see the content trend over the years. By organizing both of them by year and month they were added to the platform, I was able to spot some interesting trends and evolutions. From 2008 to 2015, the growth in content remained relatively flat. However, starting in 2016, there is a noticeable uptick in the volume of both Movies and TV Shows added to the platform. This surge likely coincides with Netflix’s global expansion and the increasing investment in original productions, which significantly boosted the platform’s popularity. The upward trend continues sharply in the following years, especially for Movies, which show a steeper growth trajectory compared to TV Shows. Despite a slower pace, the increase in TV Shows remains substantial.Interestingly, between 2020 and 2021, the final years captured in this dataset, the trend flattens again, and the number of both movies and tv shows on the platform almost remain invariate. This stabilization may reflect the broader shifts in the streaming landscape, including the emergence of strong competitors and a more saturated market environment.
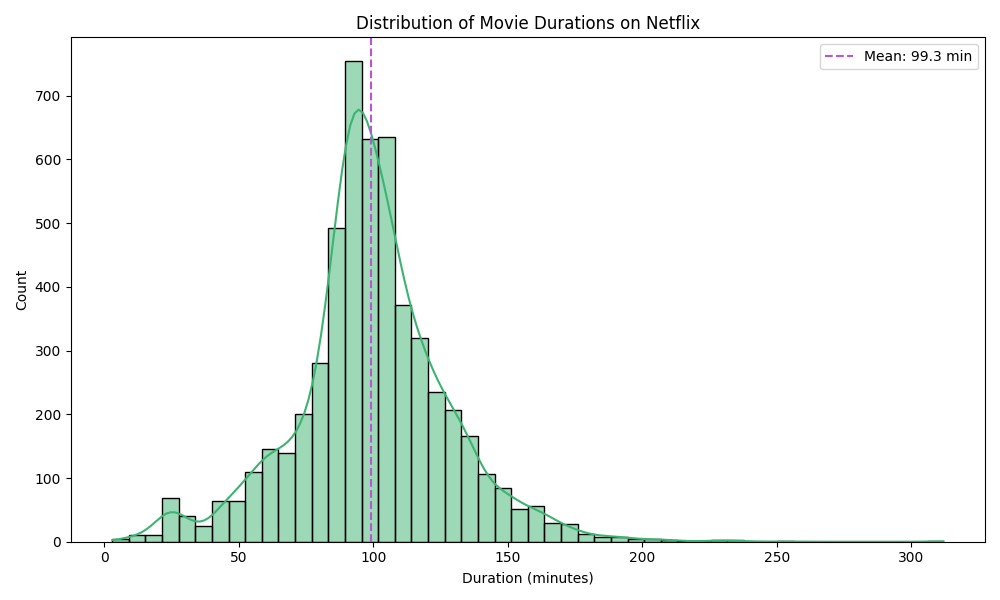
4. Movie Duration and TV Shows Seasons
The next step in my analysis was to examine how content is structured in terms of length, analysing the duration of movies and the number of seasons for TV shows. For movies, I opted to use a histogram because it provides a clear and intuitive way to visualize how durations are distributed across the catalog. To enhance this visualization, I also included a Kernel Density Estimate (KDE) curve, which provides a smoothed outline of the distribution. This helps to better identify the central tendency and the shape of the distribution. What emerges is a bell-shaped curve centered around the 90–100 minute mark, which aligns well with the traditional duration of most movies. The average movie length sits at about 99 minutes, and while there are some longer titles, the vast majority remain within a familiar range for viewers. This kind of distribution shows that Netflix tends to stick to industry norms when it comes to film duration.
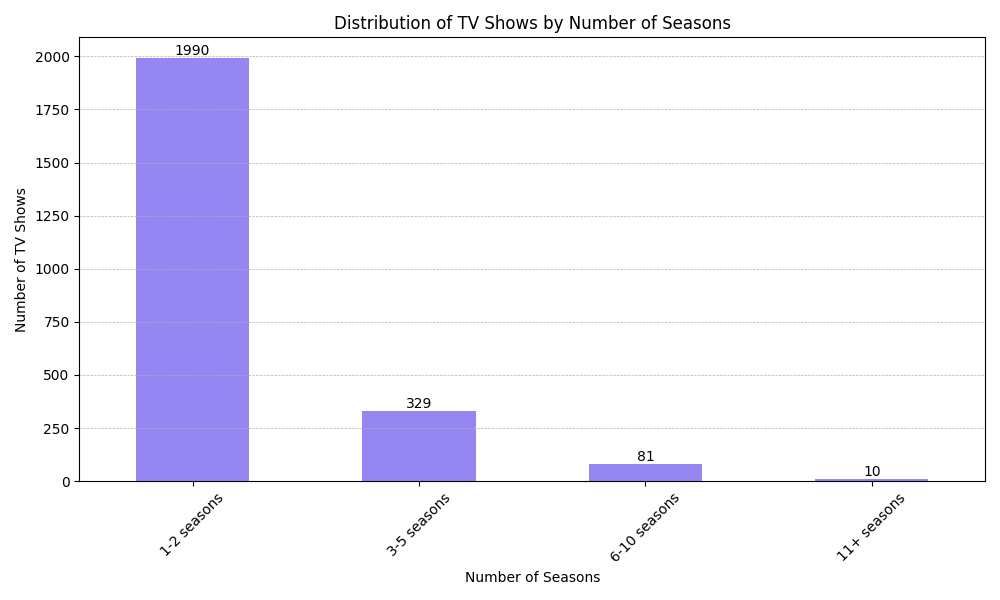
For TV shows, I looked at the number of seasons instead. The bar chart shows a very clear trend: most series on the platform have just one or two seasons. As the season count increases, the number of shows drops off. Very few reach the 6–10 season mark, and only a tiny fraction go beyond that. This suggests that many shows are either designed as short-form or limited series, the well-known mini-series, or perhaps they do not make it past the early renewal stages. It reflects a content strategy that favors fresh ideas and frequent turnover, possibly to test audience interest or manage production costs. Overall, while movie lengths stay relatively consistent, TV show lifespans vary widely, but most are kept intentionally short.
5. Release Year
show_id | title | type | release_year |
|---|---|---|---|
| s4961 | Prelude to War | Movie | 1942 |
| s6118 | The Battle of Midway | Movie | 1942 |
| s7343 | Undercover: How to Operate Behind Enemy Lines | Movie | 1943 |
| s7680 | WWII: Report from the Aleutians | Movie | 1943 |
| s7617 | Why We Fight: The Battle of Russia | Movie | 1943 |
| s6658 | The Memphis Belle: A Story of a Flying Fortress | Movie | 1944 |
| s6700 | The Negro Soldier | Movie | 1944 |
| s7269 | Tunisian Victory | Movie | 1944 |
| s3426 | Know Your Enemy - Japan | Movie | 1945 |
| s4437 | Nazi Concentration Camps | Movie | 1945 |
show_id | title | type | release_year |
|---|---|---|---|
| s4868 | Pioneers: First Women Filmmakers* | TV Show | 1925 |
| s4867 | Pioneers of African-American Cinema | TV Show | 1946 |
| s6954 | The Twilight Zone (Original Series) | TV Show | 1963 |
| s6083 | The Andy Griffith Show | TV Show | 1967 |
| s5786 | Star Trek | TV Show | 1968 |
| s4217 | Monty Python’s Fliegender Zirkus | TV Show | 1972 |
| s4218 | Monty Python’s Flying Circus | TV Show | 1974 |
| s1578 | Dad’s Army | TV Show | 1977 |
| s1950 | El Chavo | TV Show | 1979 |
| s4479 | Ninja Hattori | TV Show | 1981 |
Although Netflix is a modern platform, it houses some surprisingly old titles. By sorting content by release year, I discovered that some movies and tv shows date all the way back to the early and mid 20th century. This is more common for movies, while TV shows, due to their increasing popularity just in recent times, are generally more recent in terms of release year. However, I was surprised in finding out that Netflix hosts a tv show released in the 1940s, and one in the 1920s! These are two collections of movies that showcase the work of early female and African-American directors and performers from the early 20th century, especially from the silent film era. However, there are not just historical curiosities, but the platform also offers insight into the attempts of including classic cinema. That said, most content tends to be relatively recent. It’s no surprise that the numbers for the 2020s are lower than those for the 2010s, since the dataset only goes up to 2021. And let’s not forget, we have all seen how much new movies and tv shows have been added in since 2020, reflecting Netflix’s continued push to grow and refresh its library.
| Decade | Movie | TV Show |
|---|---|---|
| 1920 | 0 | 1 |
| 1940 | 13 | 1 |
| 1950 | 11 | 0 |
| 1960 | 22 | 3 |
| 1970 | 63 | 4 |
| 1980 | 99 | 7 |
| 1990 | 194 | 31 |
| 2000 | 601 | 127 |
| 2010 | 3951 | 1760 |
| 2020 | 423 | 476 |
6. Most Popular Contributors: Directors and Actors
Have you ever wondered who are the main directors and actors that appear on the Netflix platform? I performed a little analysis on that topic too!
The first step here was to clean the columns of director and actor. This is because, in the original dataset, both of the variable sometimes listed multiple directors, and especially multiple actors, in a single string, separated by commas. To get a clearer picture of each individual’s contribution, I split those strings into separate names. Then, I used the explode() function to turn each list of names into individual rows, so that every person could be counted on their own. This step was key to identifying the most frequently credited directors and actors, and ultimately helped generate a more accurate top 20 list.
movies_director_clean["director_clean"] = movies_director_clean["director"].str.split(r'\s*,\s*')
print(movies_director_clean[["director", "director_clean"]][:20])

directors_flat = movies_director_clean["director_clean"].explode()
directors_count = directors_flat.value_counts()
top_directors = directors_count[:20]
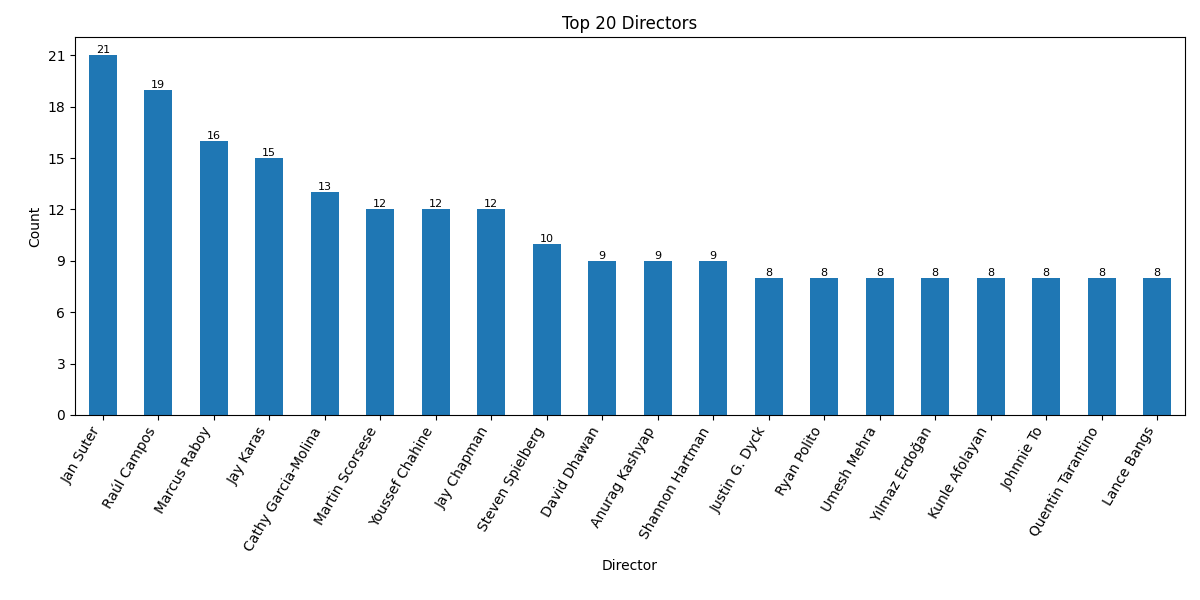
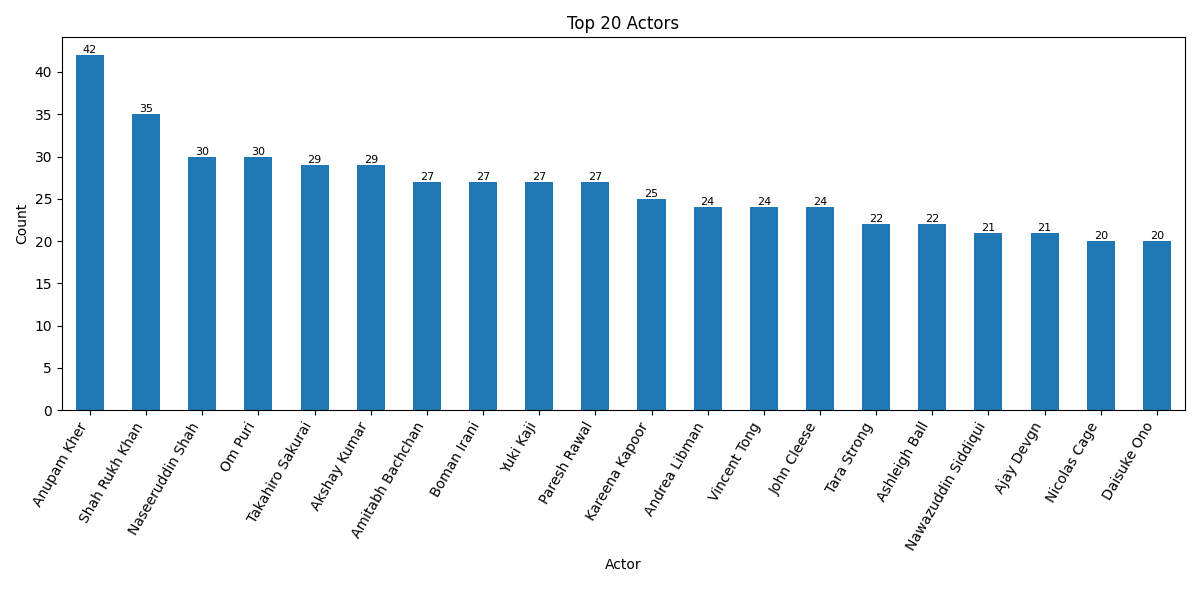
When looking at the top 20 most credited directors and actors on Netflix, a few familiar names stand out, but many are less known, which reflects the platform’s global and genre-spanning catalog. Among directors, there is a mix of international filmmakers and frequent contributors to stand-up specials and regional content. While big names like Martin Scorsese and Steven Spielberg make an appearance, the list is dominated by directors who have consistently worked on niche or localized productions, showing how Netflix invests in breadth over fame. On the acting side, the presence of Indian cinema is unmistakable. Anupam Kher, Shah Rukh Khan, and Naseeruddin Shah are among the most frequently credited, reflecting Netflix’s strong South Asian offerings. There is also a notable group of voice actors, like Tara Strong and Vincent Tong, whose extensive work in animated series contributes to their high counts, a reminder of how kids’ content and dubbing play a major role in the platform’s strategy.
7. Global Reach
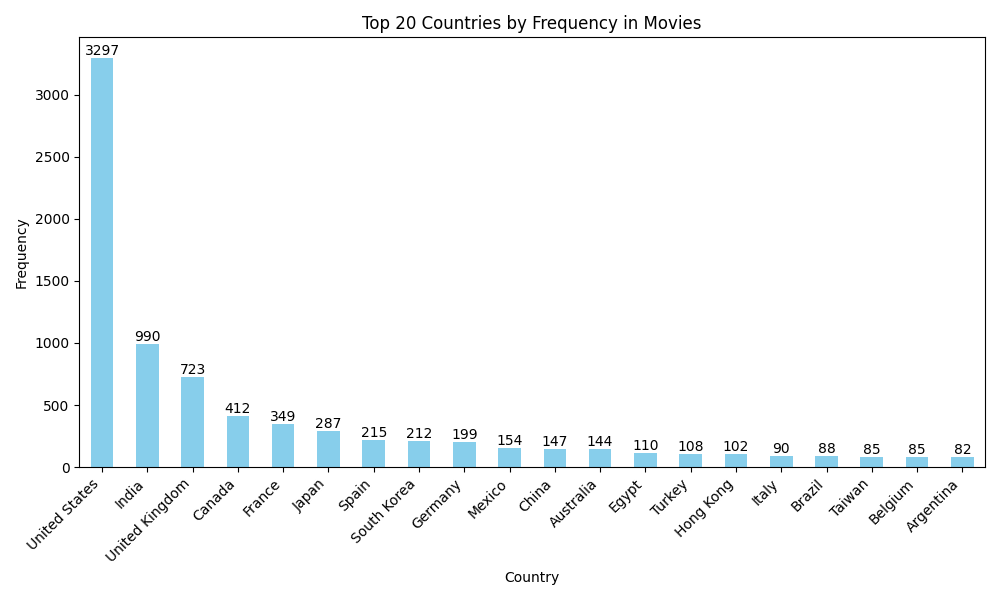
A look at the distribution of content by country in the Netflix dataset reveals a strong dominance of the United States, which accounts for the largest share of movies and TV shows. India follows as the second most represented country, highlighting its growing influence in the streaming market. The United Kingdom, Canada, and France round out the top five, each contributing several hundred titles to the platform. Other countries with significant representation include Japan, Spain, South Korea, and Germany, reflecting Netflix’s efforts to diversify its content library globally. This data underscores how Netflix has expanded beyond its U.S. roots to become a truly international platform, offering a broad range of content from across the world.
8. Genres
| Rank | Movie Genre | Movie Count |
|---|---|---|
| 1 | International Movies | 2437 |
| 2 | Dramas | 2106 |
| 3 | Comedies | 1471 |
| 4 | Documentaries | 786 |
| 5 | Action & Adventure | 721 |
| 6 | Independent Movies | 673 |
| 7 | Children & Family Movies | 532 |
| 8 | Romantic Movies | 531 |
| 9 | Thrillers | 491 |
| 10 | Stand-Up Comedy | 329 |
| Rank | TV Show Genre | TV Show Count |
|---|---|---|
| 1 | International TV Shows | 1199 |
| 2 | TV Dramas | 704 |
| 3 | TV Comedies | 525 |
| 4 | Crime TV Shows | 427 |
| 5 | Kids’ TV | 414 |
| 6 | Docuseries | 353 |
| 7 | Romantic TV Shows | 333 |
| 8 | British TV Shows | 232 |
| 9 | Reality TV | 222 |
| 10 | Korean TV Shows | 150 |
Netflix’s genre distribution offers a clear window into what audiences are watching, and what the platform is prioritizing. When it comes to movies, International Movies take the lead with 2,437 titles, followed by Dramas and Comedies. Moreover, the strong presence of Documentaries and Action & Adventure movies reflects growing interest in both real-life stories and adrenaline-driven entertainment. TV shows reveal similar patterns. International TV Shows are the top on the list with 1,199 titles, with TV Dramas and TV Comedies close behind. Genres like Crime, Docuseries, and Kids’ TV also rank high, alongside notable entries for British and Korean series. This genre breakdown highlights Netflix’s global-first approach and its commitment to offering a wide spectrum of contents, from comedies to docuseries, tailored for any kind of audience around the world.
9. Ratings
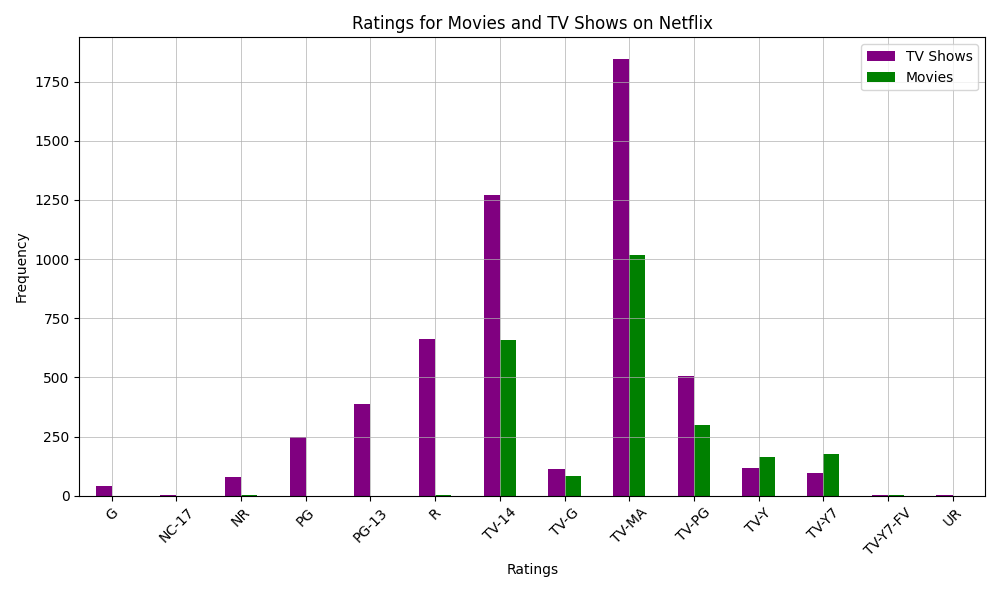
The last step of my analysis looked at the ratings of movies and TV shows on Netflix to understand what kinds of audiences the platform focuses on. The most common rating is TV-MA, which means the content is for adults and may include strong language, violence, or other mature themes. This rating is especially common in TV shows. Another popular rating is TV-14, which is for content that may not be suitable for kids under 14—this is often seen in teen and drama series. For movies, the most frequent rating is R, which means viewers under 17 need to watch with an adult. The majority of movies is also rated TV-MA, similar to TV shows. Ratings like PG (some guidance for kids) and PG-13 (parents are strongly cautioned) show up too, but not as much. Very few titles are rated G (suitable for all ages) or TV-Y (made for young children), showing that Netflix has fewer shows and movies for young kids. Overall, the ratings data shows that Netflix mostly focuses on content for teens and adults, with comparatively fewer options for younger audiences.
Conclusion
Exploring the Netflix dataset gave me a better understanding of the platform’s content, like the high number of movies, the short run of most TV shows, and how much international content is included. It also became clear that Netflix mainly targets teen and adult audiences, with less content made just for young kids.
Beyond the findings, this project was a great learning experience. I cleaned messy data, made decisions on how to deal with missing information, and practiced turning numbers into useful insights. It helped me grow more confident using real-world data and building stories from it.
It is also important to mention that this dataset only goes up to 2021, and we are now in 2025. The streaming world moves fast, and Netflix’s catalog has likely changed a lot in the past few years, especially because of new competitors, trends, and global shifts in entertainment. Still, this snapshot gave me a solid base for understanding how Netflix built its library and audience up to that point.
If you enjoyed this project, feel free to check out my other work!